Figure 4
Validation of Prognostic Scores for Attempted Vaginal Delivery in Scar Uterus
Mouiman Soukaina*, Mourran Oumaima, Etber Amina, Zeraidi Najia, Slaoui Aziz and Baydada Aziz
Published: 11 April, 2025 | Volume 8 - Issue 2 | Pages: 023-029
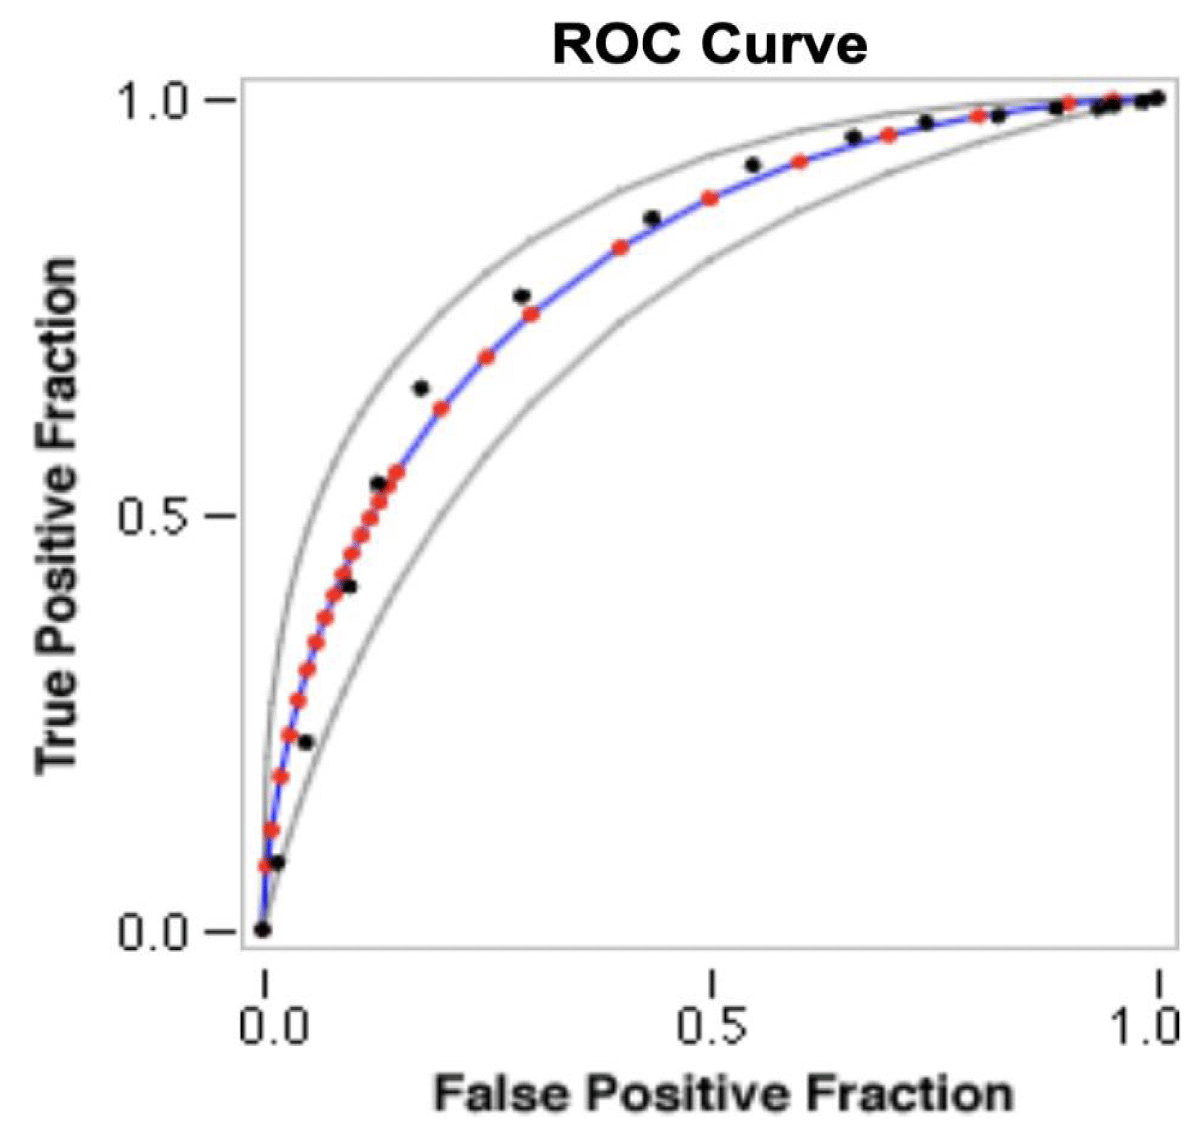
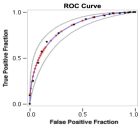
Figure 4:
Receiver-operator curve for prediction of vaginal delivery after caesarean section using the Grobman model.
Legend for the ROC graph:
- RED symbols and BLUE line: ROC curve adjusted.
- GREY lines: 95% confidence interval of the fitted ROC curve.
BLACK symbols: Points making up the empirical ROC curve.
Read Full Article HTML DOI: 10.29328/journal.cjog.1001185 Cite this Article Read Full Article PDF
More Images
Similar Articles
-
Perinatal Morbidity & Mortality following repeat Cesarean section due to five or more previous Cesarean Section done in Tertiary centre in KSASomia Osman,Gehan Farid*,Reem Mohamed Kamal,Sarah Rabie Ali,Mohamed AH Swaraldahab. Perinatal Morbidity & Mortality following repeat Cesarean section due to five or more previous Cesarean Section done in Tertiary centre in KSA. . 2018 doi: 10.29328/journal.cjog.1001007; 1: 045-051
-
Current anesthesıa for Cesarean SectıonDemet Dogan Erol*, Ismail Aytac. Current anesthesıa for Cesarean Sectıon. . 2018 doi: 10.29328/journal.cjog.1001011; 1: 061-066
-
The predictive value of the preoperative diagnostic tests in mature cystic teratomas of the ovaryHanife Saglam,Funda Atalay*,Ayse Filiz Avsar,Hüseyin Levent Keskin. The predictive value of the preoperative diagnostic tests in mature cystic teratomas of the ovary. . 2018 doi: 10.29328/journal.cjog.1001013; 1: 073-081
-
Immediate postplacental insertion of intrauterine contraceptive device (copper 375) and its complications in term of expulsion, infection and perforationBenish Khanzada*,Mala Jitendra Shahani,Areesha Kamran Khanzada. Immediate postplacental insertion of intrauterine contraceptive device (copper 375) and its complications in term of expulsion, infection and perforation . . 2018 doi: 10.29328/journal.cjog.1001014; 1: 082-086
-
Determinants of women’s perceived satisfaction on Antenatal care in urban Ghana: A cross-sectional studyAkowuah Jones Asafo*,Danquah Benedicta Adoma. Determinants of women’s perceived satisfaction on Antenatal care in urban Ghana: A cross-sectional study. . 2019 doi: 10.29328/journal.cjog.1001022; 2: 038-053
-
Trial of labor after cesarean outcomes with excessive gestational weight gainSophia Halassy*,Angela Marras. Trial of labor after cesarean outcomes with excessive gestational weight gain. . 2020 doi: 10.29328/journal.cjog.1001048; 3: 039-042
-
Triple negative breast cancer: Early stages management and evolution, a two years experience at the department of breast cancer of CHSFBouzid Nassima,Darido Jessie*,Diari Jed,Dussour Chloe,Ezenfis Joel,Cahn Virginie,Guekeu Steven,Rigonnot Luc. Triple negative breast cancer: Early stages management and evolution, a two years experience at the department of breast cancer of CHSF. . 2020 doi: 10.29328/journal.cjog.1001052; 3: 065-078
-
A case series review of patients with Thrombocytopenia and Absent-Radii syndrome (TARS) and their management during pregnancyDaniel Halperin*,Sue Pavord,Bethan Myers. A case series review of patients with Thrombocytopenia and Absent-Radii syndrome (TARS) and their management during pregnancy. . 2020 doi: 10.29328/journal.cjog.1001056; 3: 090-092
-
Clinical characteristics, management, maternal and neonatal outcome among seven severe and critically ill pregnant women with COVID-19 pneumoniaKomal Sundeep Hazari,Litty Paulose,Nimmi Kurien,Hozaifah Mohammad,Taghrid Faek A Elgergawi,Atif Bashir E Fazari*,Amar Hassan. Clinical characteristics, management, maternal and neonatal outcome among seven severe and critically ill pregnant women with COVID-19 pneumonia. . 2020 doi: 10.29328/journal.cjog.1001071; 3: 158-166
-
Comparative analysis of cesarean section using the Robson's Ten-Group Classification System (RTCGS) in private and public hospitals, Addis Ababa, EthiopiaEndalkachew Mekonnen Assefa*,Adem Janbo,Yirgu Ghiwot. Comparative analysis of cesarean section using the Robson's Ten-Group Classification System (RTCGS) in private and public hospitals, Addis Ababa, Ethiopia. . 2021 doi: 10.29328/journal.cjog.1001093; 4: 081-091
Recently Viewed
-
Treatment Outcome in Patients with Myofascial Orofacial Pain: A Randomized Clinical TrialAnders Wänman*, Susanna Marklund, Negin Yekkalam. Treatment Outcome in Patients with Myofascial Orofacial Pain: A Randomized Clinical Trial. J Oral Health Craniofac Sci. 2024: doi: 10.29328/journal.johcs.1001046; 9: 001-008
-
Hygiene and Care Protocols for Implant-supported Dental Prostheses in Patients with DiabetesHakob Khachatryan, Emma Boshnaghyan, Sevak Papoyan, Gagik Hakobyan*. Hygiene and Care Protocols for Implant-supported Dental Prostheses in Patients with Diabetes. J Oral Health Craniofac Sci. 2024: doi: 10.29328/journal.johcs.1001047; 9: 009-014
-
Advancing Oral Health and Craniofacial Science through Microchip ImplantsShekufeh Shafeie*. Advancing Oral Health and Craniofacial Science through Microchip Implants. J Oral Health Craniofac Sci. 2024: doi: 10.29328/journal.johcs.1001048; 9: 015-018
-
Texture Analysis of Hard Tissue Changes after Sinus Lift Surgery with Allograft and XenograftMohammad Azimzadeh, Farzad Esmaeili, Narges Bayat, Kasra Rahimipour, Amir Ebrahimpour Tolouei*. Texture Analysis of Hard Tissue Changes after Sinus Lift Surgery with Allograft and Xenograft. J Oral Health Craniofac Sci. 2024: doi: 10.29328/journal.johcs.1001049; 9: 019-022
-
Awareness and Knowledge of Specialists/Trainers and General Dental Practitioners about Medical-Related Osteonecrosis of the JawsAbdulhamit Taha Koca,Mustafa Bayhan,Yunus Ayberk Demir,Ayse Zeynep Zengin*. Awareness and Knowledge of Specialists/Trainers and General Dental Practitioners about Medical-Related Osteonecrosis of the Jaws. J Oral Health Craniofac Sci. 2024: doi: 10.29328/journal.johcs.1001050; 9: 023-031
Most Viewed
-
Evaluation of Biostimulants Based on Recovered Protein Hydrolysates from Animal By-products as Plant Growth EnhancersH Pérez-Aguilar*, M Lacruz-Asaro, F Arán-Ais. Evaluation of Biostimulants Based on Recovered Protein Hydrolysates from Animal By-products as Plant Growth Enhancers. J Plant Sci Phytopathol. 2023 doi: 10.29328/journal.jpsp.1001104; 7: 042-047
-
Sinonasal Myxoma Extending into the Orbit in a 4-Year Old: A Case PresentationJulian A Purrinos*, Ramzi Younis. Sinonasal Myxoma Extending into the Orbit in a 4-Year Old: A Case Presentation. Arch Case Rep. 2024 doi: 10.29328/journal.acr.1001099; 8: 075-077
-
Feasibility study of magnetic sensing for detecting single-neuron action potentialsDenis Tonini,Kai Wu,Renata Saha,Jian-Ping Wang*. Feasibility study of magnetic sensing for detecting single-neuron action potentials. Ann Biomed Sci Eng. 2022 doi: 10.29328/journal.abse.1001018; 6: 019-029
-
Pediatric Dysgerminoma: Unveiling a Rare Ovarian TumorFaten Limaiem*, Khalil Saffar, Ahmed Halouani. Pediatric Dysgerminoma: Unveiling a Rare Ovarian Tumor. Arch Case Rep. 2024 doi: 10.29328/journal.acr.1001087; 8: 010-013
-
Physical activity can change the physiological and psychological circumstances during COVID-19 pandemic: A narrative reviewKhashayar Maroufi*. Physical activity can change the physiological and psychological circumstances during COVID-19 pandemic: A narrative review. J Sports Med Ther. 2021 doi: 10.29328/journal.jsmt.1001051; 6: 001-007

HSPI: We're glad you're here. Please click "create a new Query" if you are a new visitor to our website and need further information from us.
If you are already a member of our network and need to keep track of any developments regarding a question you have already submitted, click "take me to my Query."


