Figure 1
The influence of HBV or HCV infections on the pregnancy course
Tadeusz Wojciech Lapiński*
Published: 14 August, 2020 | Volume 3 - Issue 2 | Pages: 098-102
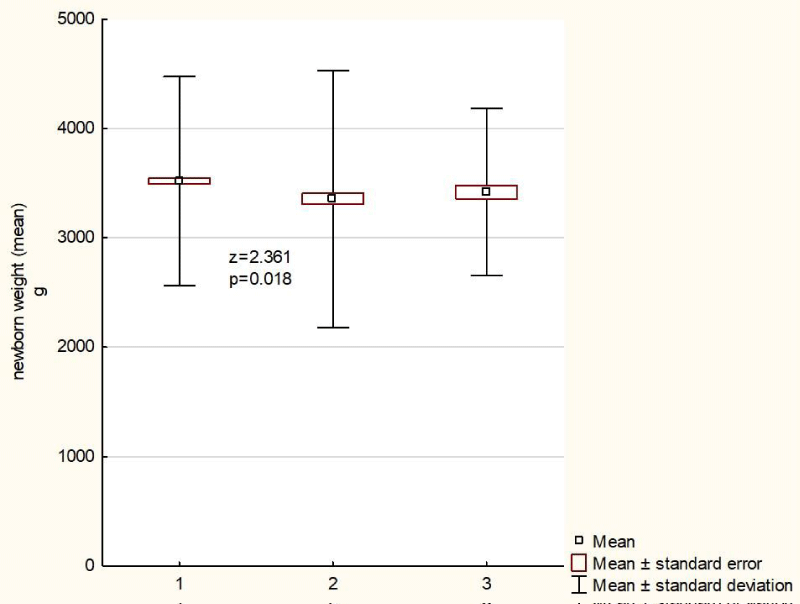
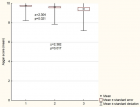
Figure 1:
Neonatal weight (mean) among the examined patients and the control group. 1 - pregnant women healthy; 2 - pregnant women infected with HBV; 3 - pregnant women infected with HCV
Read Full Article HTML DOI: 10.29328/journal.cjog.1001058 Cite this Article Read Full Article PDF
More Images
Similar Articles
-
Effectiveness of prenatal intensive counselling on knowledge, attitude and acceptance of post placental intrauterine contraceptive device among mothersM Shanthini,Manjubala Dash*,A Felicia Chitra,S Jayanthi,P Sujatha. Effectiveness of prenatal intensive counselling on knowledge, attitude and acceptance of post placental intrauterine contraceptive device among mothers. . 2020 doi: 10.29328/journal.cjog.1001044; 3: 021-025
-
Timely initiation of breastfeeding and associated factors among mothers who have infants less than six months of age in Gunchire Town, Southern Ethiopia 2019Ephrem Yohannes*,Tsegaye Tesfaye. Timely initiation of breastfeeding and associated factors among mothers who have infants less than six months of age in Gunchire Town, Southern Ethiopia 2019. . 2020 doi: 10.29328/journal.cjog.1001045; 3: 026-032
Recently Viewed
-
Metastatic Brain Melanoma: A Rare Case with Review of LiteratureNeha Singh,Gaurav Raj,Akshay Kumar,Deepak Kumar Singh,Shivansh Dixit,Kaustubh Gupta*. Metastatic Brain Melanoma: A Rare Case with Review of Literature. J Radiol Oncol. 2025: doi: 10.29328/journal.jro.1001080; 9: 050-053
-
Validation of Prognostic Scores for Attempted Vaginal Delivery in Scar UterusMouiman Soukaina*,Mourran Oumaima,Etber Amina,Zeraidi Najia,Slaoui Aziz,Baydada Aziz. Validation of Prognostic Scores for Attempted Vaginal Delivery in Scar Uterus. Clin J Obstet Gynecol. 2025: doi: 10.29328/journal.cjog.1001185; 8: 023-029
-
Scientific Analysis of Eucharistic Miracles: Importance of a Standardization in EvaluationKelly Kearse*,Frank Ligaj. Scientific Analysis of Eucharistic Miracles: Importance of a Standardization in Evaluation. J Forensic Sci Res. 2024: doi: 10.29328/journal.jfsr.1001068; 8: 078-088
-
A study of coagulation profile in patients with cancer in a tertiary care hospitalGaurav Khichariya,Manjula K*,Subhashish Das,Kalyani R. A study of coagulation profile in patients with cancer in a tertiary care hospital. J Hematol Clin Res. 2021: doi: 10.29328/journal.jhcr.1001015; 5: 001-003
-
Additional Gold Recovery from Tailing Waste By Ion Exchange ResinsAshrapov UT*, Malikov Sh R, Erdanov MN, Mirzaev BB. Additional Gold Recovery from Tailing Waste By Ion Exchange Resins. Int J Phys Res Appl. 2024: doi: 10.29328/journal.ijpra.1001098; 7: 132-138
Most Viewed
-
Evaluation of Biostimulants Based on Recovered Protein Hydrolysates from Animal By-products as Plant Growth EnhancersH Pérez-Aguilar*, M Lacruz-Asaro, F Arán-Ais. Evaluation of Biostimulants Based on Recovered Protein Hydrolysates from Animal By-products as Plant Growth Enhancers. J Plant Sci Phytopathol. 2023 doi: 10.29328/journal.jpsp.1001104; 7: 042-047
-
Sinonasal Myxoma Extending into the Orbit in a 4-Year Old: A Case PresentationJulian A Purrinos*, Ramzi Younis. Sinonasal Myxoma Extending into the Orbit in a 4-Year Old: A Case Presentation. Arch Case Rep. 2024 doi: 10.29328/journal.acr.1001099; 8: 075-077
-
Feasibility study of magnetic sensing for detecting single-neuron action potentialsDenis Tonini,Kai Wu,Renata Saha,Jian-Ping Wang*. Feasibility study of magnetic sensing for detecting single-neuron action potentials. Ann Biomed Sci Eng. 2022 doi: 10.29328/journal.abse.1001018; 6: 019-029
-
Pediatric Dysgerminoma: Unveiling a Rare Ovarian TumorFaten Limaiem*, Khalil Saffar, Ahmed Halouani. Pediatric Dysgerminoma: Unveiling a Rare Ovarian Tumor. Arch Case Rep. 2024 doi: 10.29328/journal.acr.1001087; 8: 010-013
-
Physical activity can change the physiological and psychological circumstances during COVID-19 pandemic: A narrative reviewKhashayar Maroufi*. Physical activity can change the physiological and psychological circumstances during COVID-19 pandemic: A narrative review. J Sports Med Ther. 2021 doi: 10.29328/journal.jsmt.1001051; 6: 001-007

HSPI: We're glad you're here. Please click "create a new Query" if you are a new visitor to our website and need further information from us.
If you are already a member of our network and need to keep track of any developments regarding a question you have already submitted, click "take me to my Query."


